High inflation continues to be an issue in many countries around the world, impacting the daily lives of those living in places where prices are rising rapidly. When it comes to expatriates though, how is widespread inflation affecting their packages? The impact of inflation on expatriate salaries is varied, but the impact has been clear to see with increased costs of benefits in many countries.
In times like these, benchmarking your expatriate packages is even more important to ensure you are offering competitive compensation while still keeping costs under control. Every mobility programme is different, but by using the data and insight available in ECA’s MyExpatriate Market Pay Reports, which are free exclusively to participants, you can focus your benchmark on the things most important to you.
Salary insights
Salaries are arguably the most visible and emotive element of the package, and benchmarking them helps companies to attract and keep quality talent by ensuring they provide competitive cash compensation. The personalised MySalary Graph allows for quick and simple salary benchmarking. As well as lines showing the average, lower quartile and upper quartile salaries for each seniority level (as measured in ECA points), all individual jobs submitted to the survey are shown on the graph as crosses. Your own job holders are highlighted as red diamonds, so you can see exactly where your employees sit in the market.
In addition to being personalised, the graph is interactive. You can click on items in the legend to show and hide them on the graph, and the dropdown menu above the chart switches the categories between industry group and salary methodology. For example, you can remove jobs from other industries in order to get a clearer picture, or if you use a host-based approach, only compare against others using the same methodology.
But what about those companies with internationally-mobile staff other than long-term assignees? The increasing complexity of mobility programmes can be seen in the rise of other types of expatriate, such as permanent transfers, international local hires and localised assignees. For those needing to drill down even deeper, the Total Package Listings section included as part of each report is an invaluable resource. This lists complete package details for every job included in the survey for a particular country, and is fully anonymised. Using this, you can filter to see only the details you want for an even more specific benchmark. As well as the type of expatriate, you can use it to filter for specific home location, host city, company headquarters location, family size and more.
Benefits insights
The value of a typical benefits package is often significantly higher than the salary element, and with countries such as Germany, Singapore, the UK and the USA all seeing the cost of a typical expatriate benefits package increase by 10% or more in 2022, benchmarking benefits provision has arguably become even more important.
As well as looking at what expatriate benefits are provided and how they are delivered, knowing the actual amounts that companies pay for those benefits can be extremely valuable. Knowing how you compare to your competitors can help you respond to any expatriate complaints, for example, or indicate if you need to review any aspect of your policy. In addition to showing the full details of salaries and calculation methods mentioned above, the Total Package Listings also show actual amounts for the benefits provided as part of the job holder’s package.
A recent participant in the survey provides an example of the practical value of how this information can be used in the real world. This company had been receiving an increased number of complaints about their accommodation allowances in Singapore, especially at higher seniority levels. Their policy meant the allowance varied by family size, but not by seniority, and they wanted to confirm their market position in this specific area across all levels.
All of the information needed to run this comparison can be found in the Total Package Listings, available for free with participation in the survey, but as part of a wider project we conducted the analysis on the client’s behalf. In this case, we took the accommodation data for Singapore and prepared a graph, similar to the salary graphs shown above but showing actual accommodation allowances paid to expatriates instead of salaries.
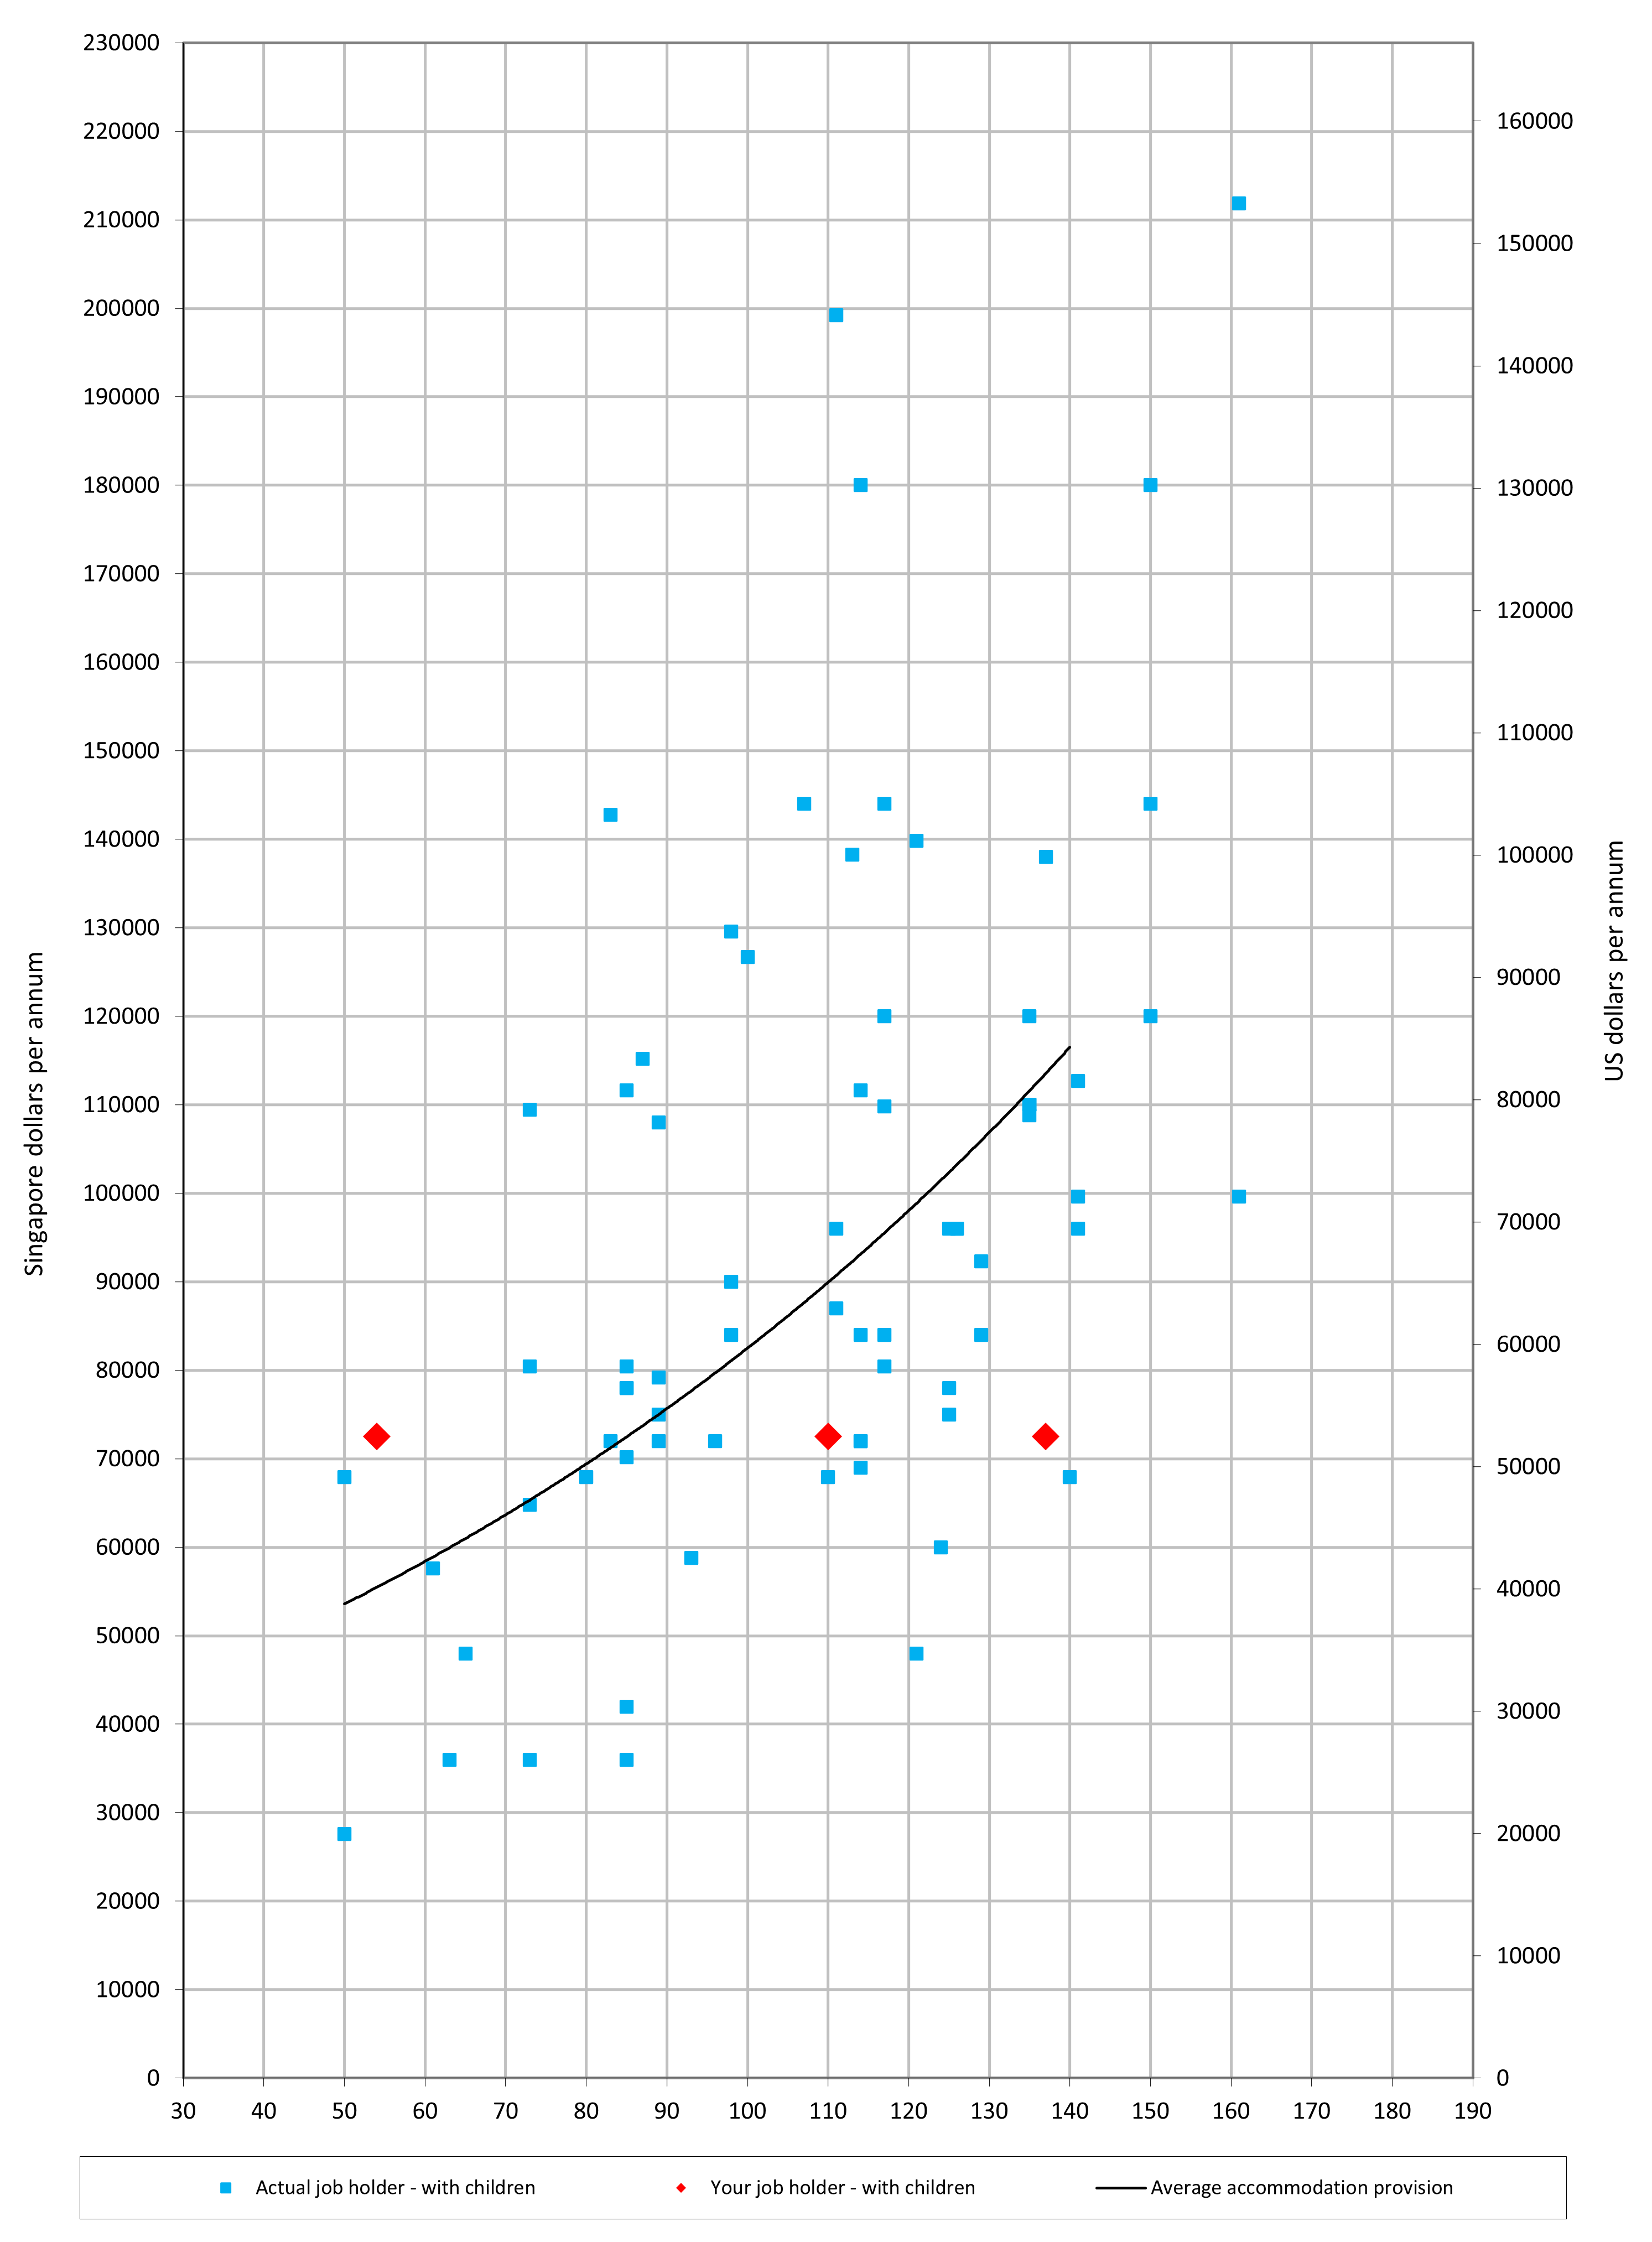
In the chart above, the blue marks indicate actual accommodation allowances paid to expatriates in Singapore, the red diamonds show the allowances paid to three of this company’s assignees, and the black line represents average allowances by seniority.
The results of the analysis, displayed on the chart, indicate that their employees at the lower end of the seniority scale are very well-off compared to the rest of the market, but those at the upper end of the seniority scale may indeed have a point in feeling like their accommodation allowances could be higher. Having information such as this equips you with independent data to help with pushback or any potential policy reviews.
The ability to evaluate the competitiveness of your packages as a whole is essential. It may be the case that your housing provision is towards the low end of the market, but you may be comfortable with that if you can see that your salaries are generous. Likewise, you may be willing to offer lower salaries but a comprehensive benefits package. By choosing the right basis of comparison for your mobility programme and considering the whole picture, you can put yourself in the best position to attract and retain key talent cost-effectively.
FIND OUT MORE
ECA’s unique MyExpatriate Market Pay Survey gathers data on expatriate salaries, benefits and GM policies from hundreds of multinational companies for more than 10 000 individual jobs, producing country-specific benchmarking reports that comprehensively illustrate the expatriate reward market in over 140 countries. The survey is now open until 25th August, and participants will receive free, personalised reports for all host countries you provide data for. Participation is not exclusive to ECA clients - any organisation with expats can take part! You can also watch a recording of a 30-minute webinar we delivered on this topic in July 2023, “Benchmarking insights for every mobility programme”.
Please contact us to speak to a member of our team directly.